 Let’s face it. When you are out of stock, it’s the buyer’s fault. When you are overstocked, it’s the buyer’s fault. And should anything go right, it is thanks to the Sales Department!
You can change that image and build a more satisfied, efficient demand planning team by understanding the purchasing process better.
Today we’re kicking off a 7-part series detailing the 7 essential steps to getting demand planning right, starting with demand forecasting:
- Demand Forecasting
- Lead Time Forecasting
- Order Cycle Optimization
- Service Level Management
- Replenishment
- Special Order Opportunities
- Order Validity Analysis
In one way or another, every buyer goes through all 7 steps. But unfortunately, many try to do all 7 in one step. The result is that they often make decisions by using irrelevant information.
Breaking down replenishment tasks into separate, sequential “decision-making” steps is the foundation of smarter inventory buying. Knowing these steps will empower your demand planning team with the tools they need to make intelligent decisions at every step of the purchasing process.
First, A Quick History on Demand Planning
Some demand planning teams have been around long enough to remember it… A time when all you needed to plan accurately was a spreadsheet, calculator and last year’s sales reports. Today??? No way. Demand is too unstable and there are many macro-economic forces that are completely out of the hands of buyers.
The reaction for many distribution businesses was (and still is, largely) to stockpile inventory to meet customer service levels. The more unstable the demand, the more you need to buy. The more you buy, the less profitable you are. As we illustrated in a previous article, moving the entire item mix from 95% to 99% service will typically increase inventory about 40%.
It doesn’t take a rocket scientist to know that increasing safety stock is an expensive blow to the bottom line. One that can be avoided with a little science.
Data Science as a Competitive Advantage
Before we jump into the 7 steps, it’s important to note that demand planning has evolved from an “art” to a “science.” From the pre-Internet days of stock cards and Suggested Order Reports to where we are today, buyers are relying less on notebooks and gut feelings. And more on science that allows them to do exponentially better work, faster.
Demand planning solutions powered by AI, machine learning and the cloud bring an advanced approach that marries the optimal forecasting and replenishment strategy with each SKU. These solutions combine Demand and Supply Planning, IBP and Multi-Echelon Inventory Optimization to make the buyer’s job super-simple, and the business super-successful.
Your inventory team can now easily identify seasonal items, work hand-in-hand with suppliers in real time, generate more accurate forecasts and gain an edge on competitors still struggling with elementary demand models. So instead of planning ‘on a hunch,’ today’s buyer is using science to:
- Order at the best possible time to minimize costs
- Eliminate the negative impact of erratic lead times
- Automatically determine which items to adjust
- Find the right smoothing model
- Measure accuracy using pattern-matching algorithms
- Automate forecasts for the entire portfolio of SKUs
- Maintain or even improve service levels with less inventory; we’ve heard of customers reducing whole truckloads per week!
Of course, a certain amount of human touch will always be needed in the buying process. After all, no machine will ever totally replace the creativity and drive of a dedicated inventory analyst. But a large part of the buying tasks can be automated and dramatically improved by science.
Now, onto the 7 steps.
Step #1: Get Demand Forecasting Right
All inventory and customer service victories require exceptional demand forecasting. The retail and wholesale distributor case studies you read, and the one you will create, will be the result of an upgrade and focus on intelligent forecasting.
Proficient demand forecasting doesn’t just help you prepare for your customer’s demand; it turns your safety stock, lead time and cycle stock calculations into precise unit values. This requires years of data, proven methods with continuously improving formulas, and an exceptional graphical interface for the buyers. Forecasting breakthroughs continue to improve accuracy and reduce the need for user interaction.
As you explore best-in-class cloud-native solutions for demand forecasting, look for a smart process, advanced intelligence and to eliminate the common, costly pitfalls.
 A Smart Process Uses Multiple Forecasting Models
The financial health of your company is at stake and it’s time to move beyond spreadsheet forecasts, simple ERP formulas and ‘circa 1970’ demand forecasting techniques.
Unlike most manufacturers, retail and wholesale distributors have thousands of items. Those items have extreme volume differences, unique demand patterns, and often surprising seasonality.
Your forecasting methods must be just as unique and diverse. One formula and one forecasting method simply won’t keep up.
Leverage Advanced Intelligence
The intelligence of today’s forecasting methods and formulas continues to accelerate. Data science tools are put in the hands of a community of scientists and mathematicians helping breakthroughs occur at a rapid pace.
These breakthroughs become victories for inventory teams. They help you find and respond to seasonality at an unmatched level, master slow-moving items, and guide you through optimizing new-item inventory. In addition, AI and management-by-exception logic dramatically reduce the need for human intervention. Inventory accuracy has hit an all-time high.
As your team takes steps from good to great, advanced intelligence will drive demand excellence in 3 key areas: Demand Forecast, Demand Deviation and Seasonal Profile. Your forecast should leverage these to describe the demand characteristics of each item in each location. They are critical attributes of the forecast.
(1) Demand Forecast: Start with the actual forecast value. This is the level of movement. It is the main number, but only part of the equation. For most forecasting methods, the next two values are also considered part of the overall demand forecast. Unfortunately, many inventory teams produce only the forecast, and are missing the deviation and seasonal insights required for success.
(2) Demand Deviation: The deviation describes the personality of the demand, and is often the missing piece when companies move from a basic method to advanced forecasting and replenishment. This value can be expressed in % or units, and is best understood through pictures like this one:
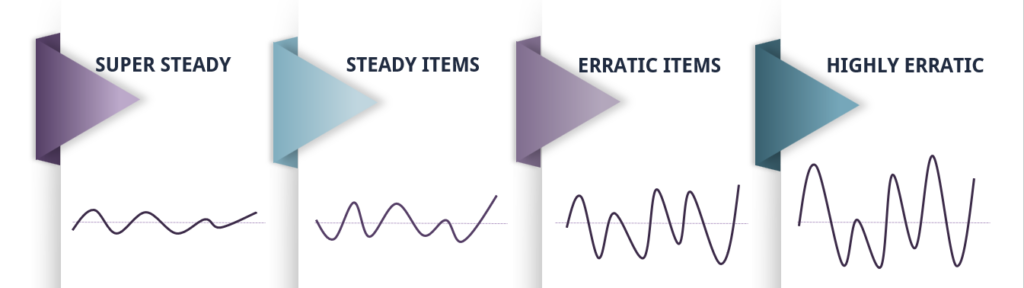
The reason this demand forecasting metric is so critical is that it plays a key role in determining the safety stock for each item. A high demand deviation value means higher safety stocks are required in order to support demand fluctuations far beyond normal.
You will find a correlation between volume and deviation
High-forecast items typically have a low deviation similar to the super steady and steady items pictured above. The more an item sells, the more likely it will sell in a stable demand pattern due to having many customers and transactions.
The slower-moving items have fewer demand experiences and customers. The demand on these items is typically more erratic. An item that sells 3 per week rarely sells in a steady pattern. It might go several periods with no sales, and then sell 8 or 9. These items have a higher demand deviation and require additional safety stock.
Merchandising and category teams should take note
The deviation value has heavy influence on your profit due to the safety stock inventory. It is a critical value to study, and should influence your merchandising decisions, including your desired service goal. Your merchandising team partners will benefit from a strong knowledge of the item’s demand deviation.
World-class inventory teams can actually tell you their overall average demand deviation. They even know how many of their SKUs fall into each of the 4 categories in the visual above.
Demand deviation is a key influencer on your company’s ability to deliver profit.
(3) Seasonal Profile: An item with any level of seasonal pattern is not complete without a seasonal forecast or profile.

Related: Getting Seasonal Adjustment Right in Your Inventory Purchasing
Exceptional seasonal forecasting helps to guarantee strong service in season, while also reducing overall inventory throughout the year. By distinguishing seasonal movement from random deviation, safety stock needs are lower. These seasonal forecasts also help to maintain balance in the line and ensure fluid replenishment.
Great supply chain planning solutions not only understand seasonality, but help to identify and create seasonal forecasts. Your team needs the ability to apply unique profiles on items, as well as category or group profiles where most appropriate.
New items and slow movers are just two examples of categories that require intelligent assistance and advanced tools in seasonality. Most companies we’ve talked with found at least 3x as many items requiring seasonal forecasts as they would have thought.
[Just for fun, check out our Growing List of Surprisingly Seasonal Items!]Avoid Common and Costly Pitfalls
Pitfalls are poor habits that have become common, expensive and often invisible in the hectic day of a buyer. There are a handful of pitfalls you should avoid – and can avoid – with a smart, solid process. These pitfalls are found throughout the 7 steps of the purchasing process, and demand forecasting certainly has its offenders.
Check this list. Do you and your team fall into any of these demand forecasting traps?
- Using one single demand forecasting calculation on all items, even though each item has unique characteristics and unique needs.
- Overreacting to high demand spikes, or period-to-date movement, by increasing the forecast and buying more, although the occurrences will probably not continue.
- Not taking seasonal patterns into account, which will lead to out-of-stocks during the up season, and overstock in the down season.
- Not tracking each item’s deviation tendencies for calculating safety stock and the proper analysis of each item’s true profit picture.
- Not adjusting the demand forecast or other factors properly as sizeable accounts are gained or lost in the customer mix.
- Not managing the transition of replacement items to avoid double inventory and the smooth changeover to the new items.
- Not filtering promotional movement, which will inflate the forecast as well as the inventory and often make the buying tools unusable.
What is the potential business cost of these pitfalls? Use this ROI Calculator to find out.
 What Else is Needed to Get Demand Forecasting Right?
Great demand forecasting goes beyond the math. Inventory teams with thousands of items have numerous challenges and opportunities. A lack of resources in these areas will lead to poor performance and excess inventory.
Here are some of the tools and processes you’ll need to make the move to great…
Account History / New Customer Tools: Adding stores or winning over a new customer can feel like a burden without the necessary tools. Reducing stores or losing a customer can also lead to chaos. All of it can spell inventory and service trouble if you have to manage it manually.
You need the ability to track history and forecasts by customer, by stores and even regions. With solid demand forecasting tools and processes managed by your team, and understood by the sales team, new customers can provide their purchasing history which can be added to your solution.
Your goal when adding new customers is to make your replenishment history look like you have had the new account all along. Similar steps can be taken when adding stores.
Item Replacement Tools: The replacement of items can also be a burden or a victory, depending on your capabilities.
When doing a replacement, the new item needs to extract the forecasting attributes from the old item and to combine the stock status values. Whether the item is a 100% replacement or something less, you need forecasting tools that pull those key components we mentioned above and use them to launch the new item.
Combining stock status values is just as critical. Your new item’s on-hand value needs to know that you still have 300 units on hand (or on order) of the item it is replacing. All of the stock status values need to collaborate, or you will experience excess stock during every transition.
Item Relationships and Substitutions: There are multiple scenarios where the demand of certain items needs to be combined with the demand of other items. These include parent-child item relationships, substitute items, off-label short-term promotional items, kitting relationships and more.
Without these relationships, some of your top-selling items will experience periods of no demand, which will:
- Reduce your demand forecasting,
- Increase your deviation and safety stock, and
- Disrupt your seasonal patterns
The goal for each relationship is clear: to ensure that each item receives the appropriate demand to get solid forecasts for the future. These relationships can include any combination of sharing demand + stock status values.
You Also Need Team Savvy: Some of the top-performing inventory management teams let their advanced forecasting techniques do the heavy lifting and put themselves in a position to learn and take action through advanced analytics.

Related: 7 Habits of Top-Performing Inventory Management Teams
Savvy teams use demand forecasting solutions to get superior results and forecast accuracy, which only improves every period. They apply the forecasting methods that work best for each item and item type — and will even blend the methods to deliver increased performance.
Savvy teams also measure their results in new ways. They know their key inventory analytics numbers and create supplicated views.
This requires analytical analysis far beyond high level macro numbers. In addition to measuring forecasting accuracy by item categories and suppliers, top performers review and respond to unique inventory sectors.
Finally, a savvy team does analysis by item type. Below is a sample of the sectors that require study, analysis and action:
All Items, A Items, New Items, Slow Movers, Seasonal Items, Non-Seasonal Items, Manual Forecasts, Watch Items, Manual Forecast Items, Item Merchandising Categories, Geographic Regions and more.
 Your business dictates how much time you put toward analysis. Blue-chip performers will study a combination of the above categories. Perhaps slow moving/seasonally profiled items are having trouble. New Items without Seasonal Profiles might also need attention.
Many inventory analytics are available today to tell these stories.
Top inventory management teams turn data into stories, stories into action, and action into results.
Results from Doing it Right
Exceptional demand forecasting is the catalyst of every success story. It is the foundational component of a company’s inventory reduction and service improvement. When demand forecasting is done right, there is a domino effect that sweeps through the entire organization:
- Demand is understood. Orders finally make sense. Time spent on replenishment is slashed. Non A-items, known as the other 80%, finally perform like the popular 20%. Seasons are understood, anticipated and successfully managed.
- Confidence and collaboration from sales and marketing grows. Long-term deal and promotional purchases are performed effectively. Overstocks are reduced. New items thrive from Day 1.
- New customers are brought on with ease and without disruption. Replacement and substitute items no longer cause excess inventory. The inventory team takes their rightful position in the center of the organization.
- Your inventory team will stop playing defense, and start playing offense.
Where are you on your journey to intelligent demand forecasting?
Subscribe to PlanningPosts to follow this series. Next up is Step 2: Lead Time Forecasting!