 “Sometimes the simplest lessons are the most groundbreaking.” That truth is over 30 years old, but its words still resonate loud and clear.
The goal of today’s post is to share a some surprising, yet logical ways to reduce inventory right now…
The key to reducing inventory is not to buy LESS; the key is to buy LATER. Teams that use this inventory reduction strategy and mindset will free up incredible amounts of capital for their organizations.
The key to inventory REDUCTION is NOT to buy less; the key is to buy LATER.
So as you might guess, the opposite absolutely holds true:
The key to raising service levels is typically not buying MORE; it is buying EARLIER. Perhaps we’ll save that breakdown for another day. Here we’ll explore ‘buying later’ as a strategy to reduce inventory and challenge you to see if there’s opportunity to do so in your organization.
How to reduce inventory in supply chain planning: those first few days
Let’s start with a quick word about your initial days using an advanced supply chain planning solution. Most companies experience a dramatic and welcome inventory reduction when they first move from the world of old buying reports and spreadsheets to a best-in-class inventory planning solution. The advanced forecasts offer dramatic results as expected, and the proper safety stock amounts finally being placed on each item often offer a shocking inventory reduction.
This common benefit is based on the fact that most companies carry too much safety stock on their fast-moving, or smooth ‘A’ items. Once those victories are realized, much more opportunity typically unfolds. Even a strong team with an advanced inventory planning and replenishment solution will continue to see deeper results as they increase their knowledge and be more open to coaching and growth.
When safety stock gets inflated, here’s why
The issue is all about the difference between a balanced vendor line and an unbalanced vendor line.
If you have one item in your vendor, your line is balanced. You replenish when that item reaches its low stock point or reorder point. You replenish it to the order-up-to level (OUTL). If your order cycle is 21 days, in about 3 weeks, that item will deplete again to the low stock point, and you start the cycle over again.
However, you normally have multiple items in the line. With strong forecasts, proper safety stocks, correct lead times and an order cycle strategy, the items have a strong chance to work together in rhythm and deplete at a similar rate.
If these components are incorrect, or unknown, you may believe you are buying them all up to the same 21-day OUTL. But actually, they are all sitting at very different time supplies. When this is the case, some items will reach their low stock points and likely trigger the order early. Your replenishment solution then works to buy everything up to the same level. This includes ‘topping off’ items that are only days below their OUTL.
The result is the unfortunate picture that you never let your items deplete down to where they want to be ordered. Add in the common need to hit a vendor’s required minimum order quantity (MOQ), and the inventory can really inflate.
Read more about replenishment optimization
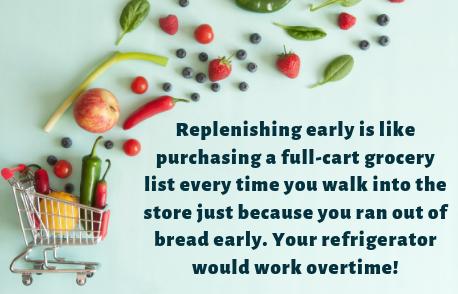
Replenishing too early is like purchasing a full-cart grocery list every time you walk into the store just because you ran out of bread early. Your refrigerator would work overtime!
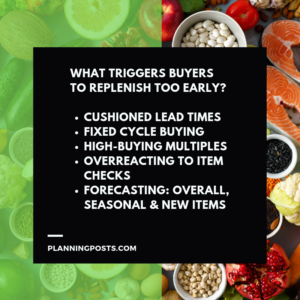
 Reasons why we replenish too early
We would probably all agree that this happens more than we’d like to admit. If you want to kick this costly habit, let’s start by creating a list of the pitfalls that trigger us to place replenishment orders too early:
- Avoid Cushioned Lead Times
Hey, we’ve all been there. A little cushion is understandable. However, you have to know the impact of that on your inventory investment.
If you are sitting on 3 or 4 days of cushion, those 3 or 4 days act as extra safety stock days and the dollars can add up.
Start by always knowing this key number: What is 1 day of inventory in dollars (or your currency) for your business? If 1 calendar day of inventory is $250,000, then 4 days of cushion is $1,000,000.
By reducing that cushion, you will reduce that secret safety stock and you will replenish later, on the next order or beyond. The inventory will drop.
Read more about lead time management
- Avoid Fixed Cycle Buying
There are several reasons to set up suppliers for replenishment on a fixed cycle. Some of those reasons are good; many are not. Hopefully, you are being compensated by your supplier in such a strong way that it exceeds the added inventory expense.
Let’s say you set the supplier to replenish on Wednesdays. Typically, the line does not actually come ‘due’ on that chosen Wednesday. It will most likely either come due before that Wednesday or after. Therefore, you establish the rules in a way to replenish the previous Wednesday or the Wednesday after.
We know which it will be! If you ever tried risking things a bit, you probably got burned and you won’t let that happen again. You will always replenish the line early. The result is that the inventory stays higher than it would if you removed the fixed cycle rule.
In addition, you might have to hit a supplier minimum bracket. Let’s say, for example, that bracket is a truckload. And of course, you don’t control the size of the truck. You also don’t control the fact that it takes 10 days to sell a truckload of product based on your forecasts.
So every time you buy, you are buying 10 days of supply. Despite sitting on 3 days of excess inventory, you replenish again next Wednesday. Now you have 6 days excess. You do this a few times until you can feel the excess and then you ‘skip a week,’ which is a common practice.
Though you probably don’t watch the build of inventory during these weeks, the build-up is happening. Inventory analysts who have experienced the opportunity to remove fixed cycle rules on lines like these can share plenty examples of the dramatic inventory reduction that follows.
- Avoid High Buying Multiples
We can all agree that the slow-moving items will often buy far above your OUTL because of typical buying multiples. An item with a forecast of 1 and a buying multiple of 6 has no option but to replenish up to 6 months’ supply. Fortunately, most of those items do not have a heavy impact on your inventory investment.
However, if your A and B items also have high buying multiples, you might find that you often ‘top off’ items far above the OUTL. Let’s stick with our supplier line that has a 21-day order cycle. If an A item is only sitting 7 days below the OUTL upon the purchase of the line, and the item has a 17-day buying multiple, it will extend 10 days past the OUTL.
You should maintain a continuous analysis of Buying Multiple days across your item groups and item forecast ranges. Buying Multiple Days should become a common measurement and reporting guide to the team.
In addition, don’t forget to include a study of large Minimum Quantities and Manual Minimums.
- Avoid Overreacting to Item Checks
Today’s supply chain planning solutions provide timely and relevant information. However, when you move from an antiquated process to an advanced process, you have to avoid the temptation to overreact.
Your replenishment system might have the ability to show you every item that could potentially run into trouble; however, you can’t afford to hit the panic button every time the system tells you to react to a situation.
You may have gone years without seeing these items, so you better have a smart inventory reduction strategy for how you react to the information.
Once example is the ability to see Low Stock Point checks. You might have a supplier of 100 items. Very possibly, a handful of items will reach their Low Stock Point well ahead of the rest of the line. These are often slow-moving, low-impact items that might suddenly sell 3 months’ supply after having not sold any for 3 months.
The line might still be in fine shape, but the items show up as a warning. Given that you prefer to keep your warning list clean, you replenish the line much earlier than you planned. The system does not want to replenish again for one full order cycle, so it takes along many items that were not yet sitting in a position of need. Thus, you ‘top off’ the rest of the line. Doing this often ensures that your inventory will always stay high.
Result: buying too early and tying up capital along the way.
- Avoid Demand Forecasting Inaccuracies
 The category of demand forecasting is a big one, so we’re breaking it down into 3 parts:
- Overall demand forecasting,
- Seasonal forecasting, and
- New Item forecasting
Forecasting overall items
Your supply chain planning solution wants to bring you into the demand conversation from time to time. It delivers report cards to you and offers exception-based replenishment optimization tools. It wants you to continually work together toward excellence.
If you don’t play your part of the equation, you might never see the full potential for demand forecasting accuracy that is possible.
Remember, the demand forecast is the most important component, as it combines and influences every other replenishment component. When you replenish everything up to a common order-up-to level, you want to trust that strong demand forecasts will ensure that the line depletes down as close together as possible.
With poor demand forecasting, the 21 days of supply level which you believe you are buying might actually be a much different time supply on numerous items. The result can be an order triggered much earlier than planned.
Forecasting seasonality
Perhaps the perfect example of a poor component that puts a line out of balance is the lack of quality Seasonal Demand Profiles on items with true seasonality. For many demand planning analysts, forecasting seasonality is one of the last areas to master. That is understandable, but it does not reduce the need for quality Demand Profiles.
One of the common ways the analysts find seasonality in items with surprising seasonality is when they continue to hit their Low Stock Points ahead of the rest of the line during their season. In fact, close attention should be paid to Trending Item Exceptions, as item seasonality is sometimes misdiagnosed as a trend.
This topic points to the advantages of a world-class supply chain planning solution that helps you easily understand and find seasonal patterns, and then apply the proper Demand Profiles.
New item forecasting
New items continue to be an area of poor performance for many inventory teams and analysts.
Demand forecasts on new items require a similar level of attention you’d give to an infant. We recently blogged about New Item Excellence, where we encouraged the “3X strategy” which says that:
If 5% of your items are new, they require at least 15% of your inventory planning attention.
Poor initial forecasts, or a lack of close attention in their early weeks, can cause items to reach their Low Stock Points early and potentially be a source of buying too early.
Watch your Average Delay Days
When you replenish a ‘Due’ supplier, what is the $Average Delay Days on the line? Create a visual of the line and start to watch where the average inventory sits when you place the order.
Continue to watch that value when you replenish the line to see if you are bringing the inventory down or if it is moving up. For more on inventory analytics, listen to the podcast: “10 Inventory Analytics Numbers Every Exec Should Care About.”
 What are your potential savings?
As we said earlier, numerous inventory teams have made this a great area of focus and analysis. They found they were often replenishing too early, refined and improved their awareness, and reduced millions of dollars of inventory across teams.
You can have similar success! Want to discuss your specific challenges? Drop us a line!